Audience
Research on behalf of product owners and other stakeholders; Usability Test Participants
Team
Myself (as User Experience Architect and designer); product owner
Challenge
Understand the visual impact of a design change and pick a best solution for a given need.
techniques & tools
Brainpower, Sketch, Powerpoint, Webex
outcome
This test showed us which of several options to choose for a new style of button for beginning a user’s workflow. The option that tested most favorably was not the one I expected.
The Setting
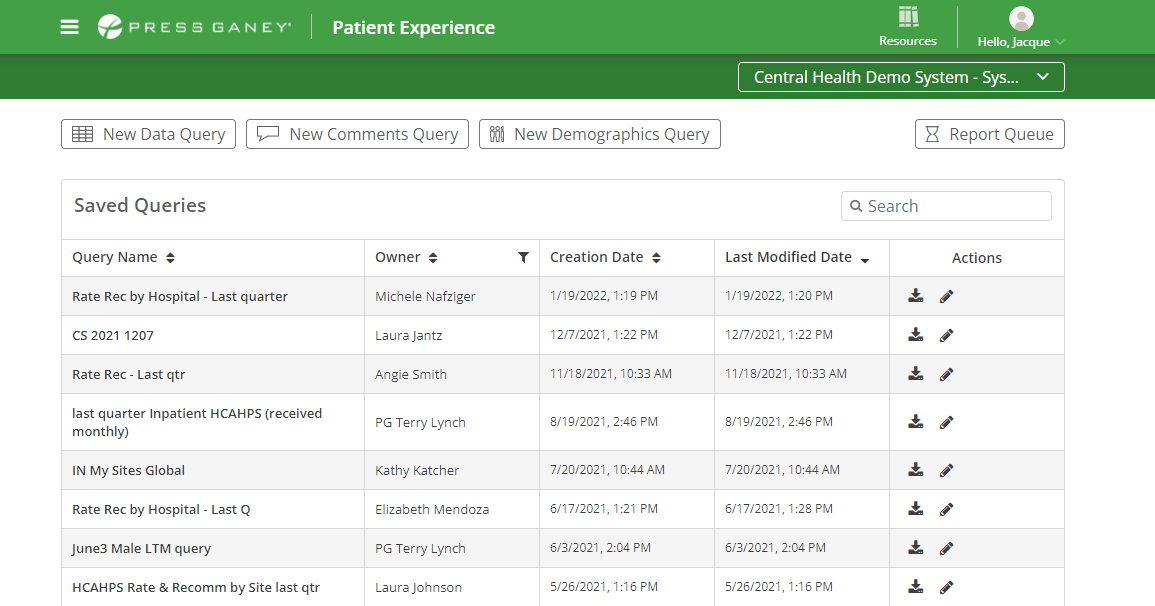
A feature of the Press Ganey website called the “Query Tool” provides users some moderately powerful tools to create their own examinations of stored data. But it’s not a freeform query builder directly against a database. There are several types of ‘preset’ queries that users can choose from.
The enhancement for which this research was done was to add a new kind of preset to those already available. Choosing the preset is done by clicking an onscreen button. This enhancement would add one more button, and we knew that additional presets would be added in the foreseeable future.
Our goal was to redesign the buttons so that:
- more of them could fit,
- they did not compete with each other and other elements on the page and
- so that they would be clearly understandable.
Design
Of course the reflex reaction anyone has is to just make another button and slap it on the page. But in this case it was not a hard problem to convince everyone (product owner, business analyst, developers/qa) that just adding another button was actually going to be a bad idea: All the existing buttons use a kind of “primary call to action” style—we all agreed that too many of those confuse the user. (We can all make jokes like “here is our list of top priorities. Every one of these is number one!”)

Elsewhere on the site, creation of ‘new’ things or actions for the user tend toward a ‘small icon with text’ style.
The number of kinds of presets was approaching the number where it might make sense to change the micro interaction for ‘new query’ to using a dropdown to select the kind of query and a start/submit button to actually begin the query. But we also agreed we weren’t quite there yet.
I’m not an ace visual/UI designer, but I have enough ideas to be dangerous and I know how to get around in Sketch. I created several designs and most of them had some merit. But how to choose?!
Let’s Decide Using Data
I introduced the product owner to the “Five Second Test.” This test is very valuable in determining the visual impact of a page: what does the user see when they arrive at the page? What opinions do they very quickly and initially form about what they can do on the page?
The procedure of the test is just what you are right now imagining. The participant is shown the page for five seconds, then the image is taken down (i.e. put a blank screen in its place). Then the participant is asked
- What do you remember seeing?
- What do you believe you can do on the page you saw?

Stimulus “B:” 20 pixel icons with labels

Optional, but helpful, show the user another design under the same protocol and ask the same questions.
Finally, allow a little bit of time for some debrief with the participant. Bring the image back up to have them talk about it and explore further.
Caveats
This is a qualitative study. Unless you have tens of participants or maybe more and you ask very specific questions and code the responses very carefully, you CANNOT derive quantitative results from it. But qualitative data is not invalid data, it simply must be considered with due caution. In my experience it greatly helps augment the ‘gut feel’ decisions that we’re often required to make.

Important: if you do show a user a second image, make sure that in your notes you keep track of which image the user saw first and which they saw second. Their understanding of the second image will be ‘informed’ by the first image, even if they can’t articulate exactly how. So what the full group of participants says about second images should not be directly compared to what they say about first images. And of course across all participants, randomize what images are seen and in which order, if you are showing them two.
The Outcome
In this case, my preferred design—the one my gut was telling me to use—did not do so well in the test. Users didn’t understand or didn’t notice the buttons
There were several observations we could make from this test.
- Participants tended not to notice the icons (stimuli A and B).
- Those who did notice them appreciated the labels; and the icons themselves did get misinterpreted (which is not a surprising finding for icons).
- If there was a preference between the icon sizes, it was slightly towards the smaller icons (stimulus B) as they made the page look less busy.
- While some participants expressed a preference for the big green buttons, it was also acknowledged that they were becoming quite a mass of green on the page (stimulus C).
In the end, we went back to the drawing board, er, drawing application and made buttons about the same size as the large green buttons, but stopped using the green “primary” style, while adding icons. The long term plan is to move either to icons (as they become the standard across the site) or to a dropdown (if/when the number of presets becomes large).